Introduction. This article presents the use of ArcView 3.2, an off-the-shelf GIS software package, to visualise and measure changes in the landscape of Przemyskie Foothills, located in South East corner of Poland, near Przemysl town, close to the Ukrainian and Slovak borders. A trial of designing optimal way of using its landscape was undertaken using the same software. Most of the geographic region of Przemyskie Foothills is protected as a landscape park with the same name. Protection of a landscape park is typically less stringent compared with protection of national parks, although the landscape park areas are usually just as big, or sometimes even bigger. Landscape protection was established in Poland to preserve typical or unique landscapes, therefore some forms of human activities, such as farming, are allowed. This is not the case for national parks.
The landscape approach is an increasingly popular framework for the analysis of environmental changes because it takes an integrated view of various physical components as well as the relationships between human activity and the forces of nature. Changes of a landscape, a dynamic and complex entity, are not easy to investigate. Each component of the landscape almost continuously evolves with its own pace and magnitude [1]. Computer-aided spatial data analysis and modelling, through the use of geographical information systems (GIS) software, can be a powerful tool in aid of such an analysis and researches.
Study Area. The Przemyskie Foothills Landscape Park covers almost 62 thousands hectares of hilly area in south-east Poland, close to the Slovak and Ukrainian borders. The Park was established in 1991. Przemyskie Foothills is part of the Middle Beskid Mountains Foothills and is the farthest in Poland located region of the Outer Western Carpathian Mountains [6]. The relief of this area is created by wide hills, as high as 350 - 550 m a.s.l., cut as deep as 150 - 200 meters by network of river valleys. It has the character of ridge-and-valley hills, rather unique in the scale of Poland [4]. Rich brown and luvisol (lessive) soils were developed on silky or loamy material here [11]. The water and climate conditions allow the production of a variety of crops, therefore people preferred to settle down in this area since the early ages.
The first people already appeared in this area at the end of upper Palaeolith. The Przemysl region was one of the most densely populated places in Poland ever since the country's founding in the year 996 [10]. Human impact on nature grew, along with the increase of population and was manifested mainly by deforestation. Land clearing was accompanied by the erosion of soils, followed by the accumulation of alluvia that took place in local valleys in the XI - XII centuries [5]. The general trend of population increase is noticeable up to the years of World War II. Population density then was a lot higher compared with the level that prevailed in the 1930s (100 - 120 people per 1km2). War and the following military action "Wisla" however, caused a rapid decrease in population. Mass shooting and arresting of people as well as their forced migration to Germany took place starting from the first days of war. In total, over 27 thousand of people from Przemysl County became unpaid labour in Germany, which comprised 12,5% of all people of the region [8, 9]. When the Red Army liberated this land from the Germans in summer 1944, new borders between Poland and Ukrainian Republic of Soviet Union was founded in the eastern vicinity of Przemyskie Foothills. It was followed by mass resettlement of Ukrainians from Poland to the east and Poles from USSR to the west. Military action under cryptonym "Wisla" was started by the Polish government in 1947. As a result, Ukrainians were resettled either to the USSR or northern and western Poland. In SE Poland where "Wisla" was executed, as much as 7000 Ukrainians and 2200 Poles lost their lives. 63 854 people were resettled from Przemysl County [12]. Many villages were burned to the ground and never rebuilt. Some Poles came here in the forties and fifties, but they could not compensate the decline in Ukrainians, so the density of population dramatically decreased to the level of 30 - 40 people per 1km2. Ever since the 1950s, the rate of population growth in this terrain has been very slow. Current trends of Polish demography do not point to any significant increases in the future. The opposite is more likely. Those dramatic changes in population levels and decline in anthropopression have strong influence on the landscape of Przemyskie Foothills. As much as third part of arable land was abandoned and one can observe there the renaturalisation of the landscape for 60 years already. The term "renaturalisation" is used here to describe the natural process of landscape succession. Decline in the anthropogenic change factor, results in the spontaneous return of landscape to its more natural state. The author finds it hard to find a more adequate term for name this process than "renaturalisation" of landscape.
Research methods. The research method was complex and required the analysis of archival and present day maps as well as aerial photographs. Due to the lack of most recent cartographic materials, field investigations were undertaken with the aim to update the most recently released map.
The Austro - Hungarian Empire between 1772 and 1918, occupied the southern part of Poland. This occupied terrain was named "Galicia" (Galizien in German or Galicja in Polish). The occupants introduced modern administration to this land. Thanks to them, one of the first censuses was conducted. Most of them were designed for military use, so they concerned mostly young men. In 1784, the Austrians also reformed the conduct of church statistics, which made surveying easier and faster and therefore made results more reliable [2]. Those statistical data were used to complement this research. Austrians were also the authors of the first highly detailed maps of South Poland in small scale. Although there are older maps of Przemyskie Foothills, they are hardly useful for landscape research due to their large scale and unreliable content.
In the years 1772 - 76, the survey of Galicia took place, which resulted in a map being made in 1:72 000 scale. This map was then reduced to the scale 1:288 000 and published in 1790 as "Koenigreich Galizien und Lodomerien". In 1824 the same map was published again, after updating its contents. It was the oldest map used in this research. Although map was generally useful, results of its analysis are unfortunately imprecise because of the difficulties in defining areas due to inaccuracy and scale. The second map (Spezialkarte, K. u. K Militar-geographisches Instytut) that was used is from circa 1912 and also far from perfection. This Austrian map, however, has a more suitable scale for landscape research - 1:75 000. Inexactness of this map comes from the fact that borders of forested areas are hard to define. This monochromatic map shows relief in an old fashioned way. Instead of contour lines authors used shadowing, which makes it very hard to find borders of forests, since both things were shown in the same colour. The map that can be considered modern, is a coloured one from the years 1936-39 printed in 1:100 000 scale by the Polish Military Geographical Institute (WIG). After the World War II the Polish State Cartographic Publisher (PPWK) issued maps in scale 1:50 000 that depicted the environment in the years 1964-74. There are also maps in scale 1:25 000 from the early eighties but they have not been investigated for this research. The most recent map of the area is a digitally-based map in the scale 1:100 000 made for the order of Polish National Inspection of Environment (PIS). The maps covered the whole terrain of Przemyskie Foothills Landscape Park.
To investigate the landscape changes more closely, two villages were selected - Lomna and Letownia. Comparisons were made on the land uses in both villages between the years 1852 and 2002. Austrian occupants for military and taxation purposes prepared the cadastral maps from 1852. Franz Joseph I ordered them in 1817, triangulations and other measurements were undertaken in 1844-54 [7]. Maps are coloured and show all elements of land use in a very precise manner, due to map's scale - 1:2 880. However the recent land use situation was presented in black and white aerial photographs in scale 1:13 000, field verification was necessary to use these pictures due to their lack of colour.
All cartographic materials were scanned with standard resolution 300 dpi (dots per inch) in full colour except for aerial photographs. As the materials were in black and white, they were scanned as one but with higher resolution - 600 dpi. The next step was rectification. This means giving the scanned maps cartographic coordinates.
To rectify, the National System of Geographic Coordinates of 1965 was used, because most of available maps were representing it. All materials were rectified to represent the same type of projection and coordinates. This way, every rectified cartographic material can be compared with another since they represent the same projection and scale, regardless of the original features of the maps and aerial photographs.
The last operation was to digitise all possible themes of maps. Digitisation was done with "screen method". Digitised themes can represent three types: point, linear and polygonal. Settlements were considered as point type, because of the scale of maps and also their marginal significance compared with the vast area covered by a landscape park. The same was done in the case of village comparison. Even though houses are polygonal units in small scale like 1:2 880, they were still digitised as points, because they were not too important in this research. Roads and small rivers were assigned linear themes. The most important aspect of this research were assigned to polygonal themes, such as: fields, meadows, pastures, orchards, forests and barrens as well as big rivers and old river-beds.
This way, comparable maps of the same terrains (Park, Lomna and Letownia village) from different years were achieved. Computer-aided spatial data analysis and modelling, through the use of Geographical Information Systems (GIS) software, such as ArcView version 3.2 were conducted. To rectify maps, ArcInfo was used in a few cases.
ArcView was used, to analyse land use changes. Each theme of each map has its attributes: point themes have numbers, linear themes have numbers and length and polygonal - numbers and area. Lengths and areas were calculated using script "calcapl.ave" suggested by the authors of the ArcView software. Once those data are available, ArcView can show the statistics of each theme such as: sum, count, mean, maximum, minimum, range, variance and standard deviation. Given data were noted down and are show below in table 1.
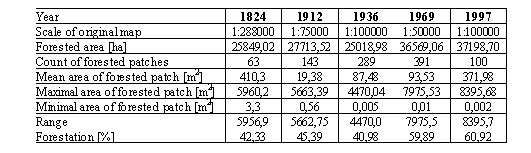
Table 1. Statistic data of forested areas of Przemyskie Foothills Landscape Park
ArcView is also a useful tool in spatial planning. GIS techniques can complement the decision making process by demonstrating the best way of using a particular piece of land given specific conditions. Landscape parks are protected lands and naturally, the leading use for them is in recreation, although recreational activities must not threaten the natural environment. Furthermore, significant parts of majority of landscape parks in Poland, including Przemyskie Foothills Landscape Park, are used for farming.
The landscape of the study area is a picturesque mosaic of forests and arable lands located on hills. Forest covers almost 2/3 of the Park. That kind of landscape is highly desirable for the recreational purposes as numerous poll-research proves. The main task of managers of the landscape park is to set a balance among different kinds of uses of the land and conditions of nature.
Knowing how the landscape of Przemyskie Foothills has developed in the past, trial of designing of its optimal use concerning specific features of local condition was undertaken. Since this land was depopulated and agricultural technology meant that the demand for land decreased, only the most productive soils on the relatively flat terrain should be cultivated. Steeper slopes should be forested to prevent soil erosion.
With the aim of making an analysis that would show optimal land use in such conditions, the following data were collected: relief and inclination of slopes, type of soils and distance to the settlements as well as roads. As collecting all of these data is labour-intensive and time-consuming, analysis was done for only two characteristic areas of the Park. The first is village Lomna and its surrounding (38,6 km2) and the second is village Letownia (16,4 km2).
First of all, contours were digitised in a range of 5 meters based on topographical
map in scale 1:25 000. Then, a model was built by interpolation achieved by the "spline" method (scipt: "interpol.ave"). The second layer added represented soils. Here, digital maps
of soils in scale 1:100 000 were used. Last layers represent roads and settlements previously digitised from aerial photographs and topographical map in scale 1:25 000. ArcView was then given particular criteria for each layer as follows:
1) for the farming: inclination of the slope < 8 degrees (14 %), soils of 1 to 8 quality classification, distance to the village < 2 km and distance to the paved or dirt road < 0,5 km.
2) for the forestation: inclination of the slope > 8 degrees (14 %), soils of 9, RN and N quality classification.
The threshold value of the inclination of slopes was set up on 8 degrees (14 %) because most of the soils of Przemyskie Foothills demonstrate only insignificant vulnerability for erosion on such slopes, with rainfalls as high as 600 - 800 mm annually (Jozefaciuk 1999). Soils of this land were classified according to quality/fertility on a scale of 1 to 9, with 9 being the least fertile. RN means a complex of soils that should be forested and N means barren. Analysis has been done by performing logic operations on digitised layers. The results obtained were then compared with the current state of landuse, which helped design areas where landuse should be changed.
Results. The analysis of old and recent maps conducted with ArcView 3.2 GIS software proves that growing anthropopression has led to land clearing in the Przemyskie Foothills Landscape Park. When this terrain became depopulated and anthropopression diminished, the landscape of the Park became subject of re-naturalisation. Semi-natural landscapes are dislodging cultural ones ever since the cultivation of land was stopped. Parallel to the diminishing forests, fragmentation of landscape has grown. In the beginning, only the best soils were cultivated, but with the growth of settlements, cultivation extended to less favourable areas. Those processes grew in intensity proportional to number of inhabitants. Analysis of available maps show that the lowest forest cover and biggest fragmentation of landscape in the history of Przemyskie Hills took place when population was highest, which is in thirties of XX century. Therefore there is a strong correlation between density of population and degree of modification of the landscape. Table 1 shows data yielded by measurements on digitised maps. Forestation of the Park goes down to 1936 and then starts to grow. A number of forest patches in 1912 are smaller compared with those in 1936, which means that fragmentation of the landscape was bigger. However, despite obvious changes that took place after the war, such as distinct tendency of the forest boundary to descend along slopes and vanishing of glades, maps from 1969 show even higher number of forested patches along with bigger forestation. It is obvious that this change is caused by different scale of the map from 1969. Being more precise, it shows more of forested patches, while in truth that number should be at least the same if not smaller. The same goes with the map from 1824. It occurred less useful for the research, because its scale is a significantly bigger then scale of other map. Together with primitive technique of surveying and drawing maps, it thus gives unreliable results. Only 63 forest patches were monitored on that map and the smallest patch appears to have a relatively large surface, but the map shows small forestation. One should note that the forestation of the case study area in reality could have been higher and reach up to 46 to 48%, perhaps even more. Similar problems occur with the newest digital map. It was made using a different technique than the previous ones discussed and even though digital maps are precise, the problem is that the degree of generalisation was not made explicit.
Better results were achieved in case of cadastral maps and aerial photographs of chosen villages. More elements were analysed than just forest. The scales and degree of generalisation were comparable, therefore results are more reliable. Lomna village was totally destroyed and all its inhabitants were killed in 1946 and the land consequently abandon.
This is the typical situation in Przemyskie Foothills Landscape Park, although changes were not so drastic everywhere. Letownia is one of only few places in the Park where anthropopression has not really changed in last century. Comparing old materials with recent ones, an indisputable trend in the changes of landscape can be observed (see Table 2). Comparing the period before the last war and today, anthropopression decreased, manifested in the expansion of semi-natural landscapes such as forests and meadows, while surfaces of arable lands and pastures grew smaller. Borders between landscape units are consequently shorter; areas of ecotones are decreasing. Swelling anthropopression in the past was accompanied by a high degree of fragmentation of the landscape. Landscape units, understood as single patches of homogeneous landscape were smaller in size, when human activity was high, because of continuous, partitioning the land from generation to generation. Traditionally, each son of a farmer got an equal part of his father's land both in quality and quantity. Expansion of human impact reached higher along slopes and harder to access terrains. Comparing maps of abandoned lands and soils shows that poor soils were taken into cultivation as last one. As demand grew, farmers were gradually reaching into land that was not initially found to be attractive enough. However as a result of rapid depopulation, large areas of arable lands were deserted. Terrains with poor soils and difficult agricultural conditions were neglected first when anthropopression intensity decreased. Depopulation and consequent decrease of anthropopression triggered a process of renaturalisation, helped nowadays by foresters. Abandoned fields and pastures became overgrown with high grass, then bush and eventually forest. This is why fragmentation of landscape is lower now and its diversity decreased significantly.
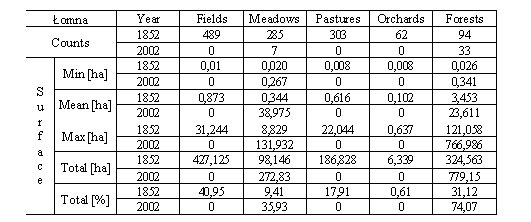
Table 2. Changes of landuse of Lomna village in years 1852-2002
Conclusion. GIS software is a modern and powerful tool in geographic or landscape researches (among many others). While preparing materials for analysis is time and labour consuming, it can demonstrate not only quantity but also quality of changes; its directions, speed and magnitude. It can be also very helpful in spatial planning as it can design optimal land-use by given criteria. Therefore if researchers share enough data, even a prognosis of future changes of landscapes can be achieved and different scenarios can be analysed or considered.
The significant obstacle in researches like these is the lack of materials. It is almost impossible to find really reliable, detailed maps older than 150 years. Previously used techniques of making them were simply not good enough. Some older maps are hard to get, very often use of those maps means a cost of hundreds of Euro, which can be a critical problem, especially for researchers from eastern part of Europe.
Despite the rectification, which has to be done on each cartographic material that is going to be analysed, not all materials can be compared. In case of maps of significantly different scales analysis is useless because the divergent degrees of generalisation of the maps make results incomparable. The scarcity of archival maps causes additional problems.
As almost the whole surface of the Earth has been already surveyed in many ways and for many purposes, numerous thematic maps have been drawn and most processes that rule changes of environment and processes of nature are known, GIS seems to be the future tool of geography. Ways of using it and purposes are countless and limited only by the imagination and creativity of researcher.
Literatura
Anthrop M. Landscape change: Plan or chaos? // Landscape and Urban Planning. 1998. No 41.
Budzynski Z. Ludnosc pogranicza polsko - ruskiego w drugiej polowie XVIII wieku: stan, rozmieszczenie, struktura wyznaniowa i etniczna. TPN Przemysl, WSP Rzeszow, 1993.
Jozefaciuk A. Ochrona gruntow przed erozja. Poradnik dla wladz administracyjnych i samorzadowych oraz sluzb doradczych i uzytkownikow gruntow. Pulawy, 1999.
Klimaszewski M. (red.) Geomorfologia Polski, t. 1. Warszawa, 1972.
Klimek K., Lanczont M., Nogaj-Chachaj J. Aluwia malych dolin w obrebie w obrebie przykarpackiej wysoczyzny lessowej jako wskaznik zmian uzytkowania ziemi w ostatnim 1000-leciu // Czlowiek w srodowisku przyrodniczym. Sosnowiec, 2003.
Kondracki J. Geografia regionalna Polski, Warszawa, 2000.
Konias A. Kartografia topograficzna Slaska Cieszynskiego i zaboru austriackiego od II polowy XVIII wieku do poczatku XX wieku. Katowice, 2000.
Konieczny Z. Straty wojenne miasta i powiatu przemyskiego (1939 - 1945) // Rocznik Przemyski. Przemysl, 1975.
Krycinski S. Przemysl i Pogorze Przemyskie. Przewodnik. Pruszkow - Olszanica, 1997.
Kunysz A. Przemysl w pradziejach i wczesnym sredniowieczu. Muzeum Okregowe w Przemyslu. Przemysl, 1981.
Mapa Gleb Polski 1:300 000 / Red. A. Musierowicz.
Misilo E. Repatriacja czy deportacja. Przesiedlenia Ukraincow z Polski do ZSRR 1944-1946. Warszawa, 1996.